
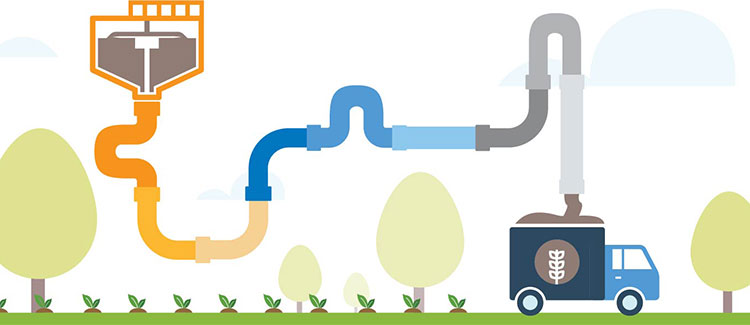
Wastewater treatment facilities across the country generate sludge as part of the treatment process. To dispose of the sludge, the sludge must be treated and either hauled to a landfill or land applied as a biosolid. Biosolids are nutrient-rich, and the treatment process allows them to be safely land applied as a fertilizer to fields or crops. For many facilities, land application is a much cheaper and more environmentally friendly option than hauling to a landfill.
Challenges that biosolids programs face
Land application of biosolids is regulated by federal and state guidelines and is highly dependent on weather conditions and time of year. In recent years, several drivers have caused biosolids programs to face increased pressures, uncertainty, and higher costs:
- Climate change – increased precipitation and changing weather patterns are reducing the available time to land apply.
- Rising hauling costs
- Soil conservation practices reducing tilling
- Potential future regulations for nutrient loading in land-applied solids
- Land use changes – increased development and less local agriculture
Despite these issues, Class A biosolid production is not widespread due to the upfront costs associated with the process change. Biosolids are difficult to evaluate from a static point of view due to the variability. Whether it’s changes in sludge production, thickness, or weather – several factors affect the ability to land apply every year. Therefore, Clark Dietz has created a modeling tool to track biosolids programs year after year to help identify the primary factors affecting costs to signal the right time to make a change.

Class A biosolids meet strict pathogen reduction limits that allow them to be land applied with minimal restrictions or even be bagged and sold as a fertilizer product to the public. Class B biosolids are treated but still contain detectable pathogen levels. For this reason, Class B land application is subject to restricted public access and crop restrictions.
Biosolids Modeling in Excel: Demo Video
How we help analyze the costs of your biosolids program
The process begins by working together with wastewater and biosolids program staff to gather as much information as possible about every facet of biosolids production. We take this information and develop a mass balance that calculates sludge production as well as energy use, labor, chemical use, operation, and maintenance. Next, these calculations are used with current operating costs to estimate the cost of the biosolids program. From there, we have built-in graphs to help analyze the results. For example:
O&M costs for each option, broken down into categories
such as truck maintenance, labor, electricity, fuel, chemicals, etc.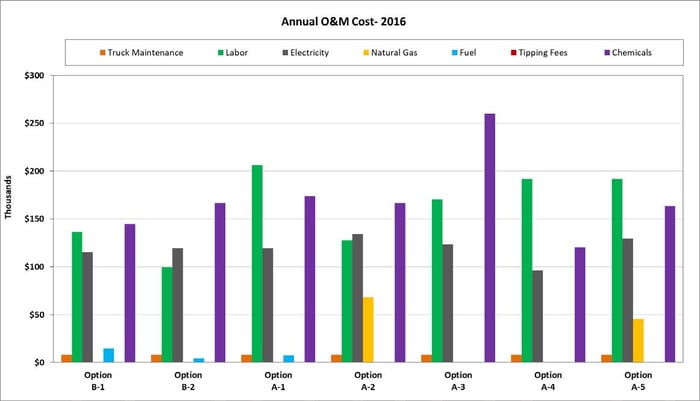
Life cycle cost comparisons, broken down by costs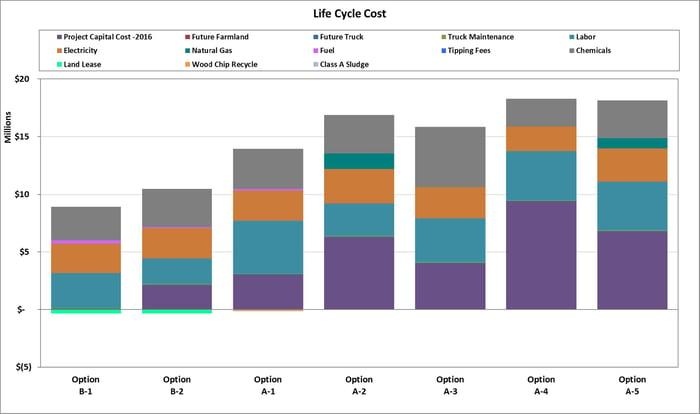
Life cycle cost over time to help identify which is the best option over a planning period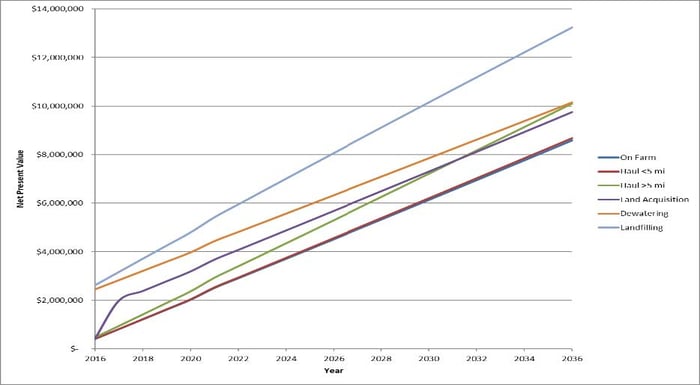
The models above are developed in Microsoft Excel with easy to use cost and process input pages to encourage owners to update costs year to year to track their biosolids program and tailor the outputs to what matters most to them.
Most facilities already have a grasp on what works best, but this model allows the user to more intricately understand the factors that are affecting the biosolids program. By evaluating various biosolids production and disposal scenarios, we can perform a sensitivity analysis to identify which factors have the greatest impact on biosolids’ costs. With this information, wastewater treatment plants can make informed capital improvement planning decisions with supporting data to back them up.

The Walworth County Metropolitan Sewerage District hired Clark Dietz to identify the most cost-effective way to handle excess sludge that could not be land applied at the end of the season. Facing rainy springs and early frosts, the District was forced to haul excess sludge to offsite storage. The result was higher costs and less control over the biosolids program.
Through the creation of a biosolids model tailored to their situation, Clark Dietz was able to identify over $1.5 million in estimated savings over a 20-year planning period by modeling the impacts and alternatives of bad weather on biosolids application for Walworth County Metropolitan Sewerage District. Based on our recommendations, the District moved forward with a capital purchase of additional land near the plant and has since been able to meet their biosolid application needs. With the model on hand, they can update their costs and track their biosolids program for years to come and eliminate some of the uncertainty caused by changing weather and land use patterns.